

Reports and the dashboard
Guide published:
The Dashboard is your home screen. It shows the rent figures for the period you pick. The Reports page holds the longer reports: rent collection, arrears, tenant risk, monthly performance and more. This guide takes about five minutes.
Prefer to watch first? This 30-second video shows the same screens, with no sound.
Reading your dashboard
Section titled “Reading your dashboard”- Click Dashboard in the sidebar.
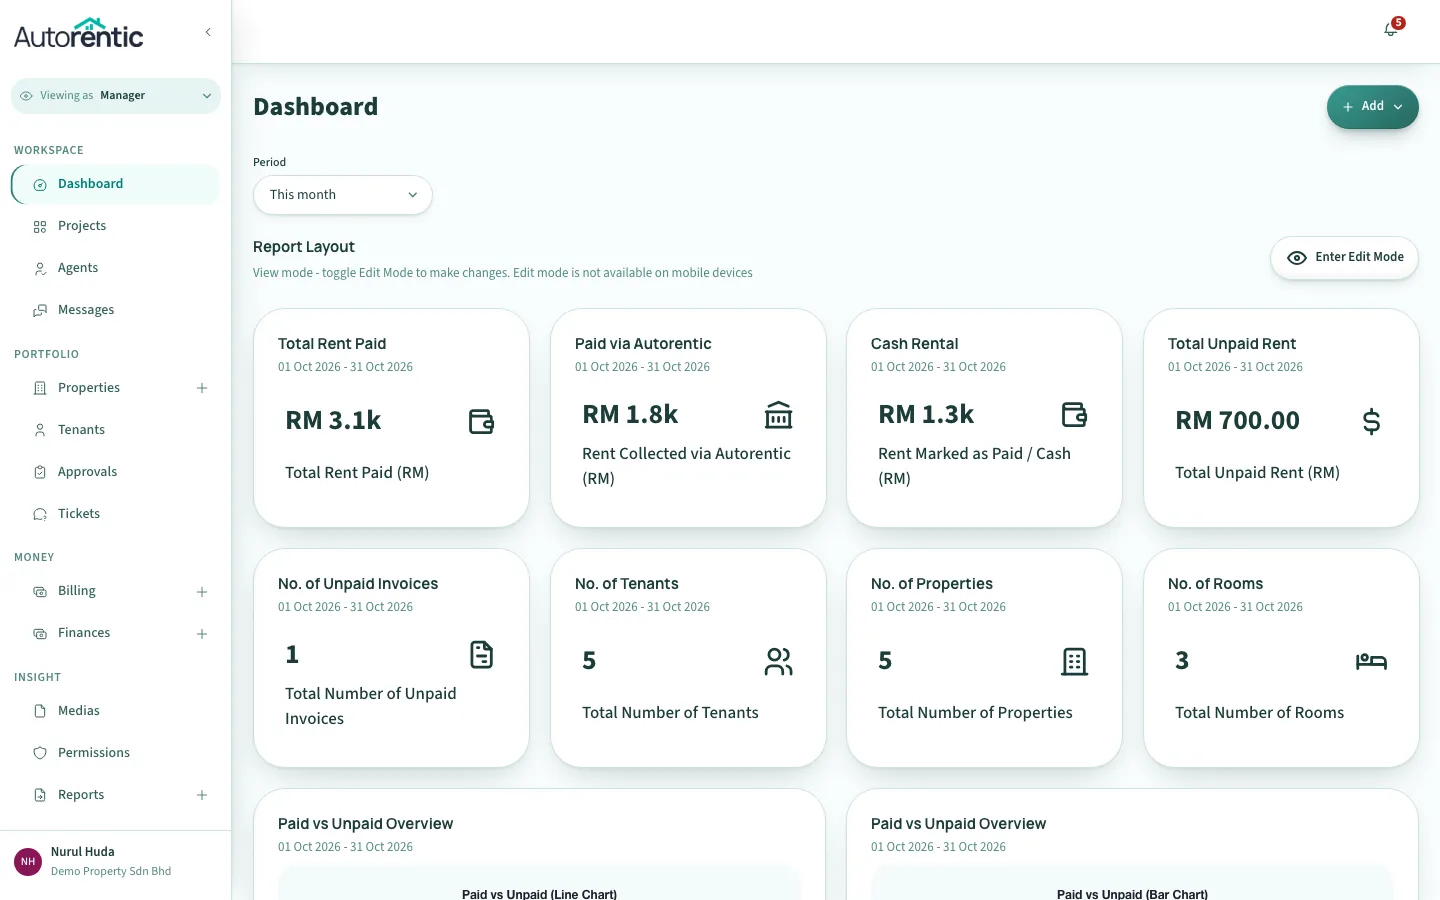
Each card shows a label, a big figure, and one line saying what the figure counts. Big amounts are shortened to fit the card. Hover over the figure to see the exact amount.
What the main figures mean
Section titled “What the main figures mean”- Total Rent Paid: rent on bills marked Paid, for bills dated in the period.
- Paid via Autorentic: rent tenants paid online through Autorentic in the period.
- Cash Rental: rent you marked as paid yourself, in cash or by bank transfer, in the period.
- Total Unpaid Rent: rent still owed on bills dated in the period. A bill that is part paid counts only what is still owed. Draft invoices (the app also calls them proforma) are not counted.
- No. of Unpaid Invoices: how many bills make up the Total Unpaid Rent figure.
- No. of Tenants: the number of tenants as of the end of the period.
- No. of Properties and No. of Rooms: the number of properties and rooms you have.
Two figures can look different for the same month. Total Rent Paid counts a bill in the month printed on the bill. Paid via Autorentic and Cash Rental count money in the month it was recorded. So a bill from last month that you were paid for this month appears in Cash Rental this month, but not in Total Rent Paid.
Changing the period
Section titled “Changing the period”- Click the Period box above the figures. It shows This month.
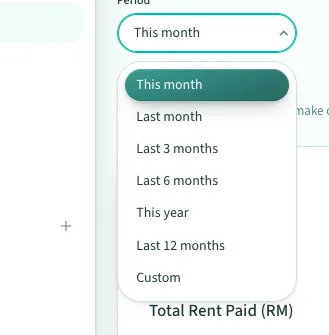
- Click the period you want. The figures change to match.
The choices are This month, Last month, Last 3 months, Last 6 months, This year, Last 12 months and Custom.
To pick your own dates:
- Click Custom. Two boxes appear: Start Date and End Date.
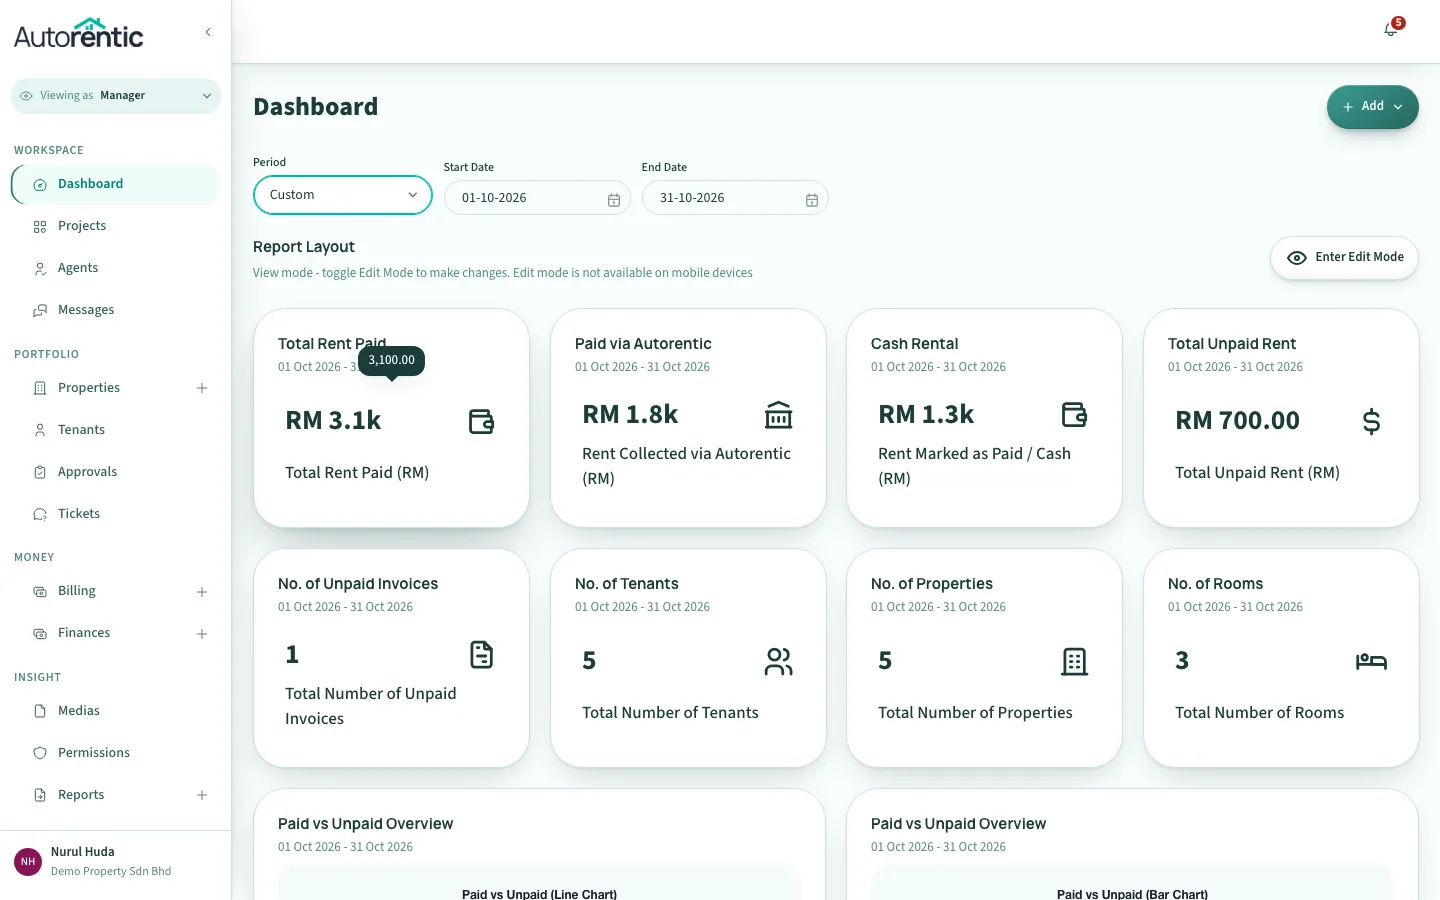
- Pick a start date, then an end date. The start date cannot be after the end date, and the end date cannot be after today. If you try, Autorentic shows a message and keeps the date you had before.
Rearranging the dashboard
Section titled “Rearranging the dashboard”Edit Mode lets you move, add and remove the cards on your dashboard. It works on a computer or tablet. On a phone, the button is greyed out.
- Click Enter Edit Mode above the layout.
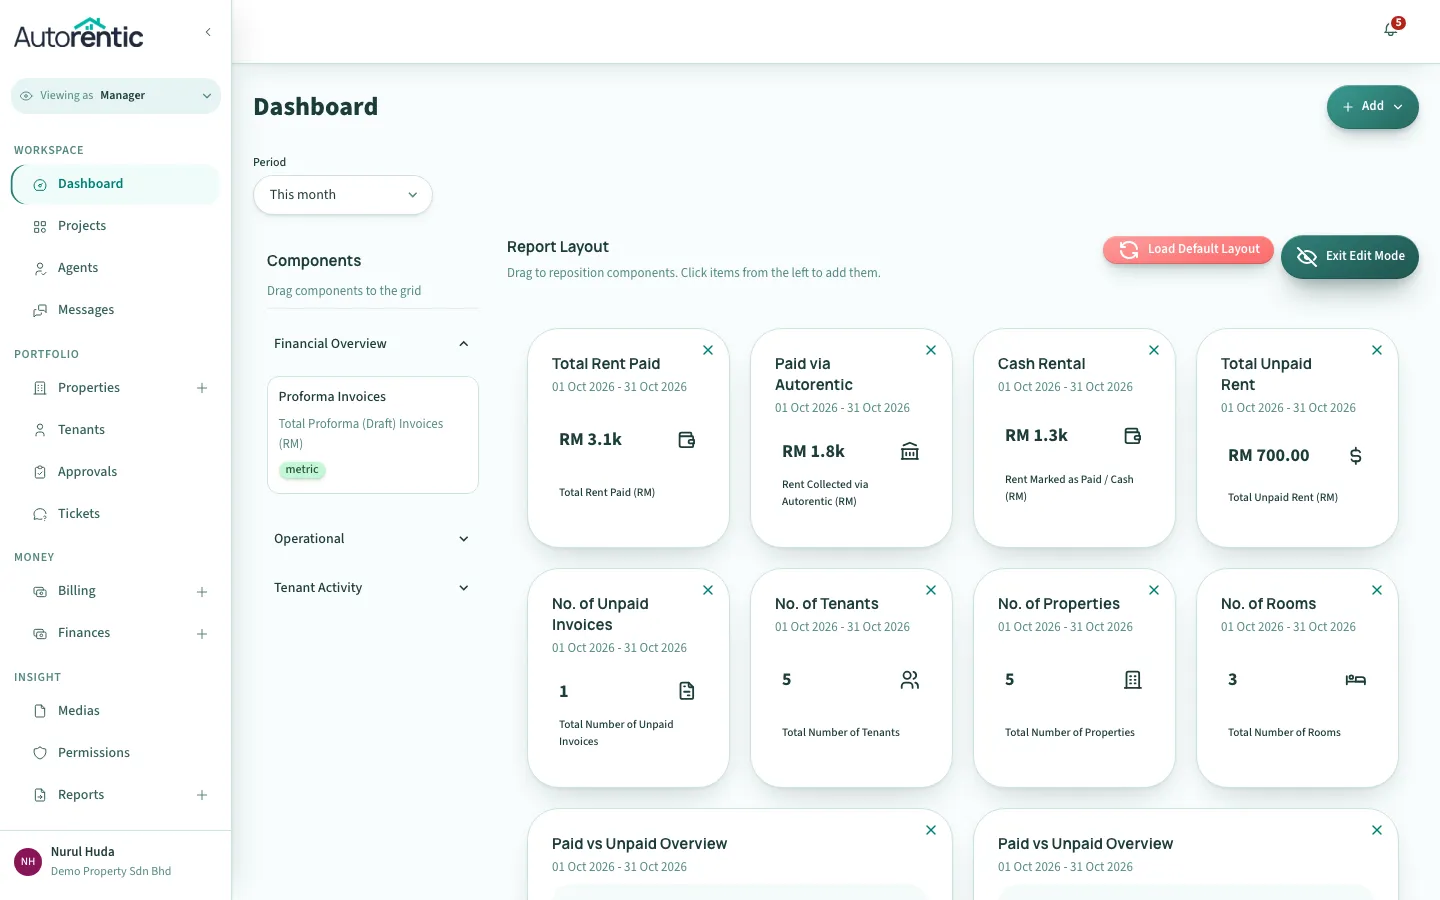
- To add a card, drag a component from the Components panel on the left onto the grid.
- To move a card, drag it to another place on the grid.
- To remove a card, click the X in its top-right corner.
- Click Exit Edit Mode. Autorentic saves your layout when you exit.
Load Default Layout also appears in Edit Mode. It puts back the standard arrangement and saves it straight away, without asking you to confirm.
The Reports page
Section titled “The Reports page”- Click Reports in the sidebar, then click Reports under it.
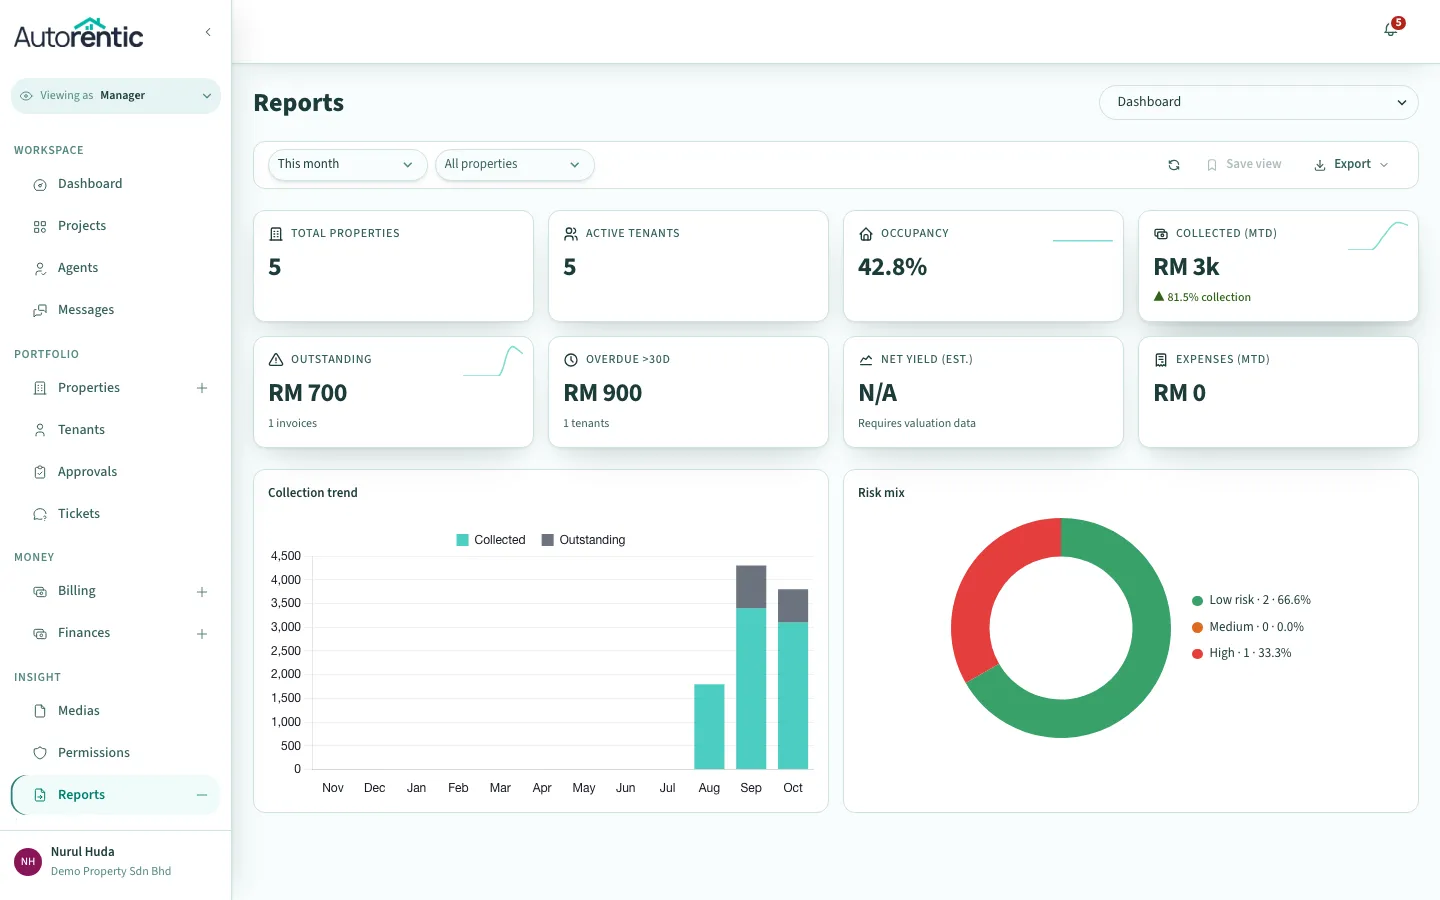
- Click the report menu at the top right and choose a report. The page changes to that report.
These are the reports in the menu:
- Dashboard: a one-page summary for the period you choose, with a collection trend and a risk mix.
- Portfolio Overview: how each property performs, with its occupancy, rent collected, collection rate and a status of Healthy, Watch or At risk.
- Rental Collection: how much was invoiced, collected and is still outstanding, and how rent was paid.
- Outstanding & Arrears: every unpaid bill with the days late. See Chasing unpaid rent.
- Tenant Performance & Risk: how each tenant pays, grouped as Low, Medium or High risk by the share of their rent they have paid.
- Monthly Performance: revenue against target and against expenses, month by month, for the year so far.
- Property Deep-Dive: one property in detail, with its occupancy, rent, tenancies or rooms, and expenses.
- Area / City / State: the same figures grouped by location.
Filters on each report
Section titled “Filters on each report”Above each report, you can change:
- Period: This month, Last month, Last 3 months, Last 6 months, This year or Last 12 months. Custom dates are on the dashboard only.
- Property: All properties, or one property. Type part of a property code to find it quickly.
Some reports add their own filter, such as Bucket on Outstanding & Arrears and Tier on Tenant Performance & Risk.
Along the same row:
- Refresh data (the circular arrow) reloads the figures.
- Save view is greyed out and shows Coming soon. You cannot save a view yet.
- Export saves the report to your computer.
Exporting a report
Section titled “Exporting a report”- Click Export.
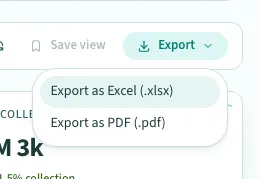
- Click Export as Excel (.xlsx) or Export as PDF (.pdf).
Autorentic shows Export completed and the download starts. If it shows Export failed, try again.
If your plan does not include export, the Export button is greyed out. Hover over it to see Upgrade your plan to export reports.
Reading the Property Deep-Dive
Section titled “Reading the Property Deep-Dive”- Choose Property Deep-Dive in the report menu.
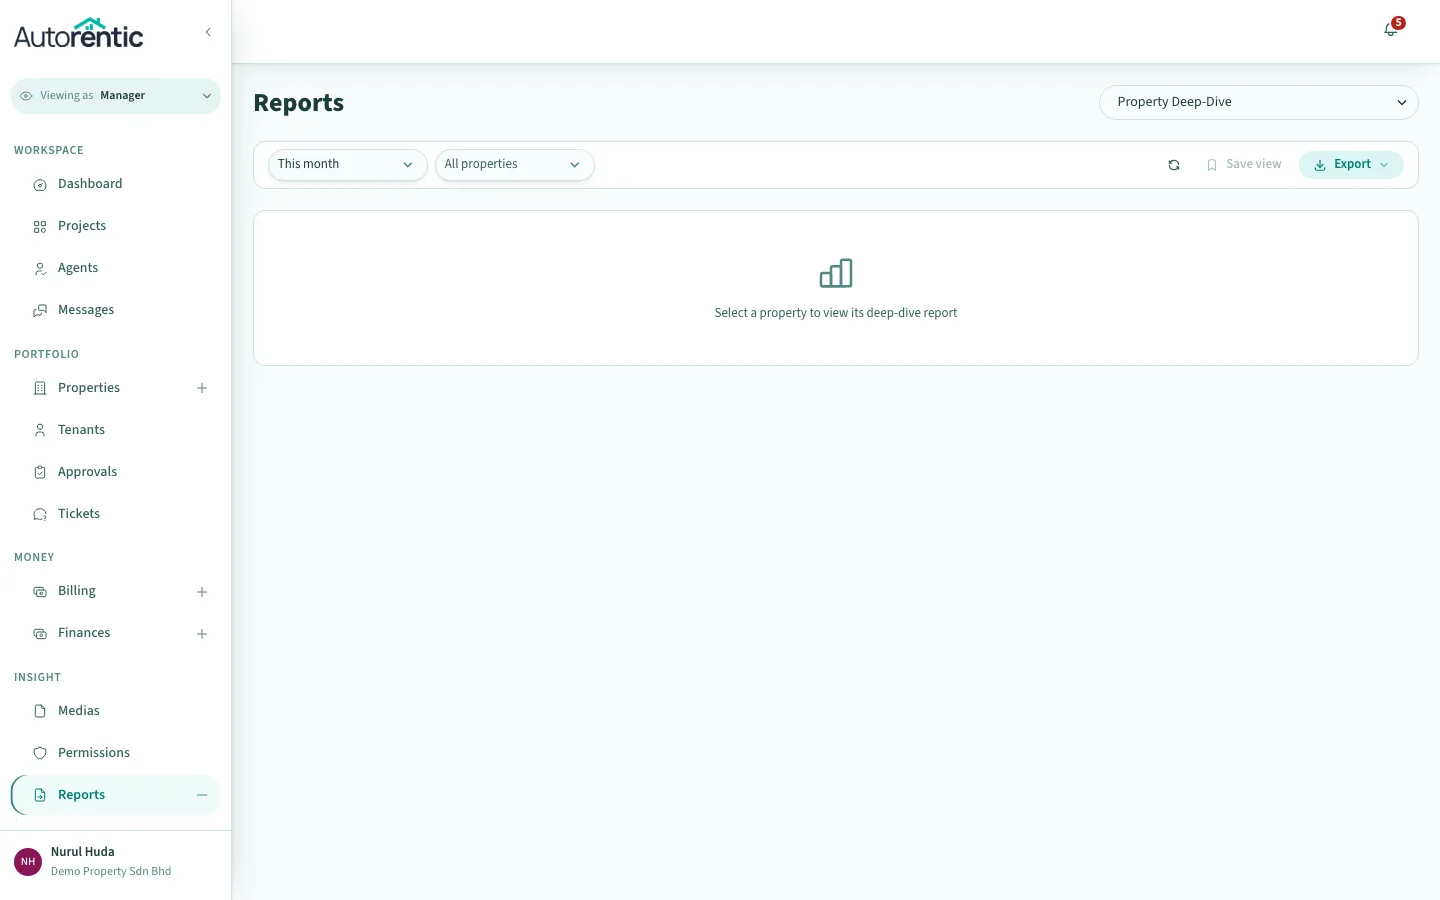
- Click the Property box, then choose a property.
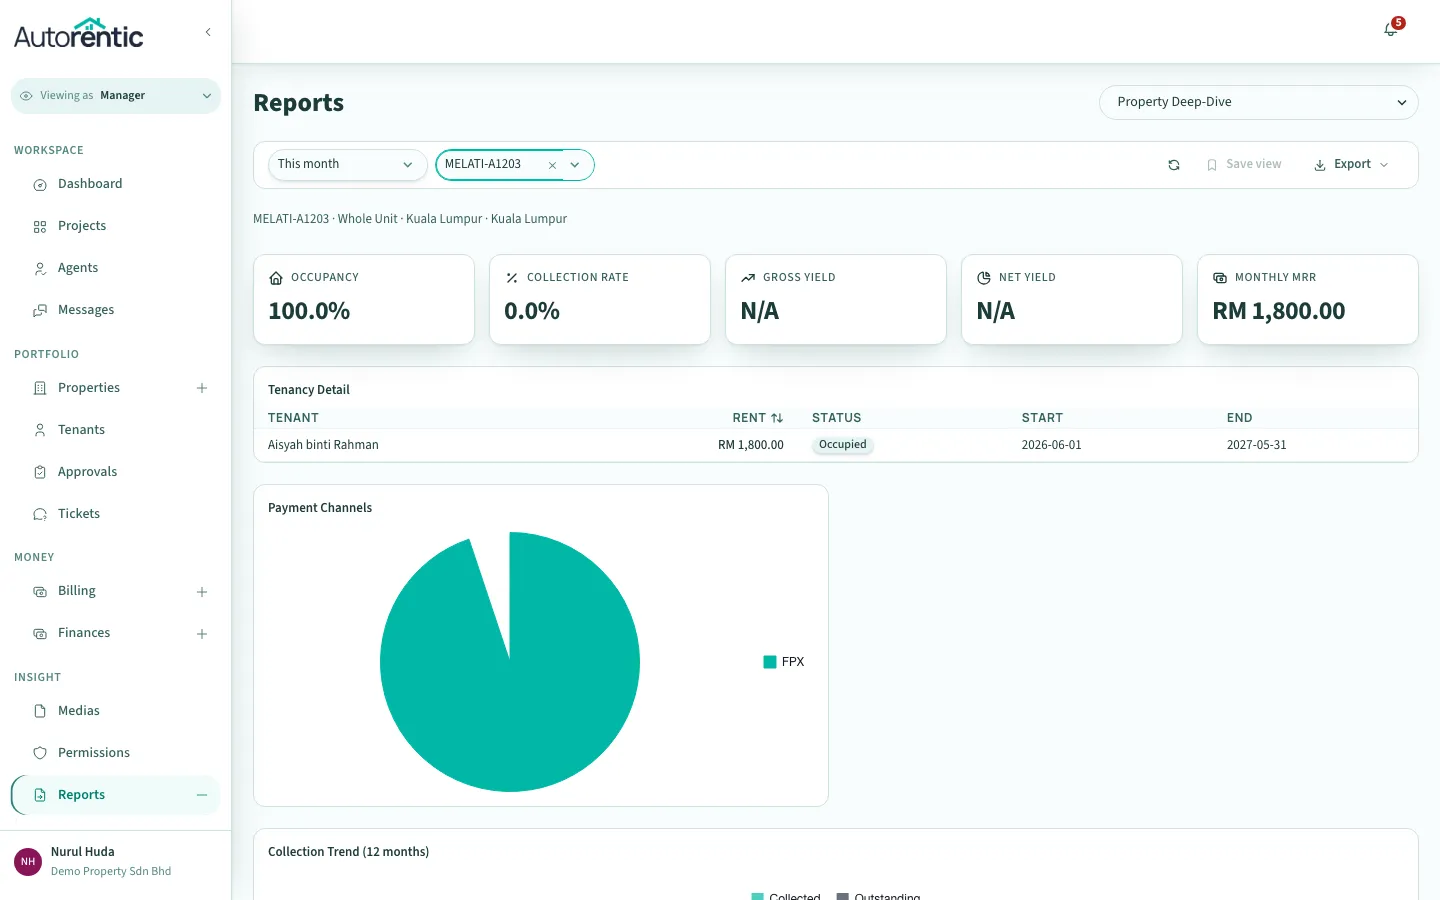
What to do next
Section titled “What to do next”- If the unpaid figures are high, open Outstanding & Arrears, then read Chasing unpaid rent.
- If a tenant paid you in cash or by bank transfer, record it. See Recording a cash or bank-transfer payment.
- If a figure looks wrong, check the Period box first. The dashboard and each report use the period chosen on that screen.
Ready to try it?
Go back to Autorentic and do it now, while the steps are fresh.